Overall UXE Score
7.59
Assessed by the editors · −0.3 vs season average
- Recognition
- Featured
- Recognized
- 25 Sept 2026
- How it got here
- Chosen by the editors
- Studio
- JSON Crack
- Assessed as
- Interaction Design
- Platforms
- Web
01/Overview
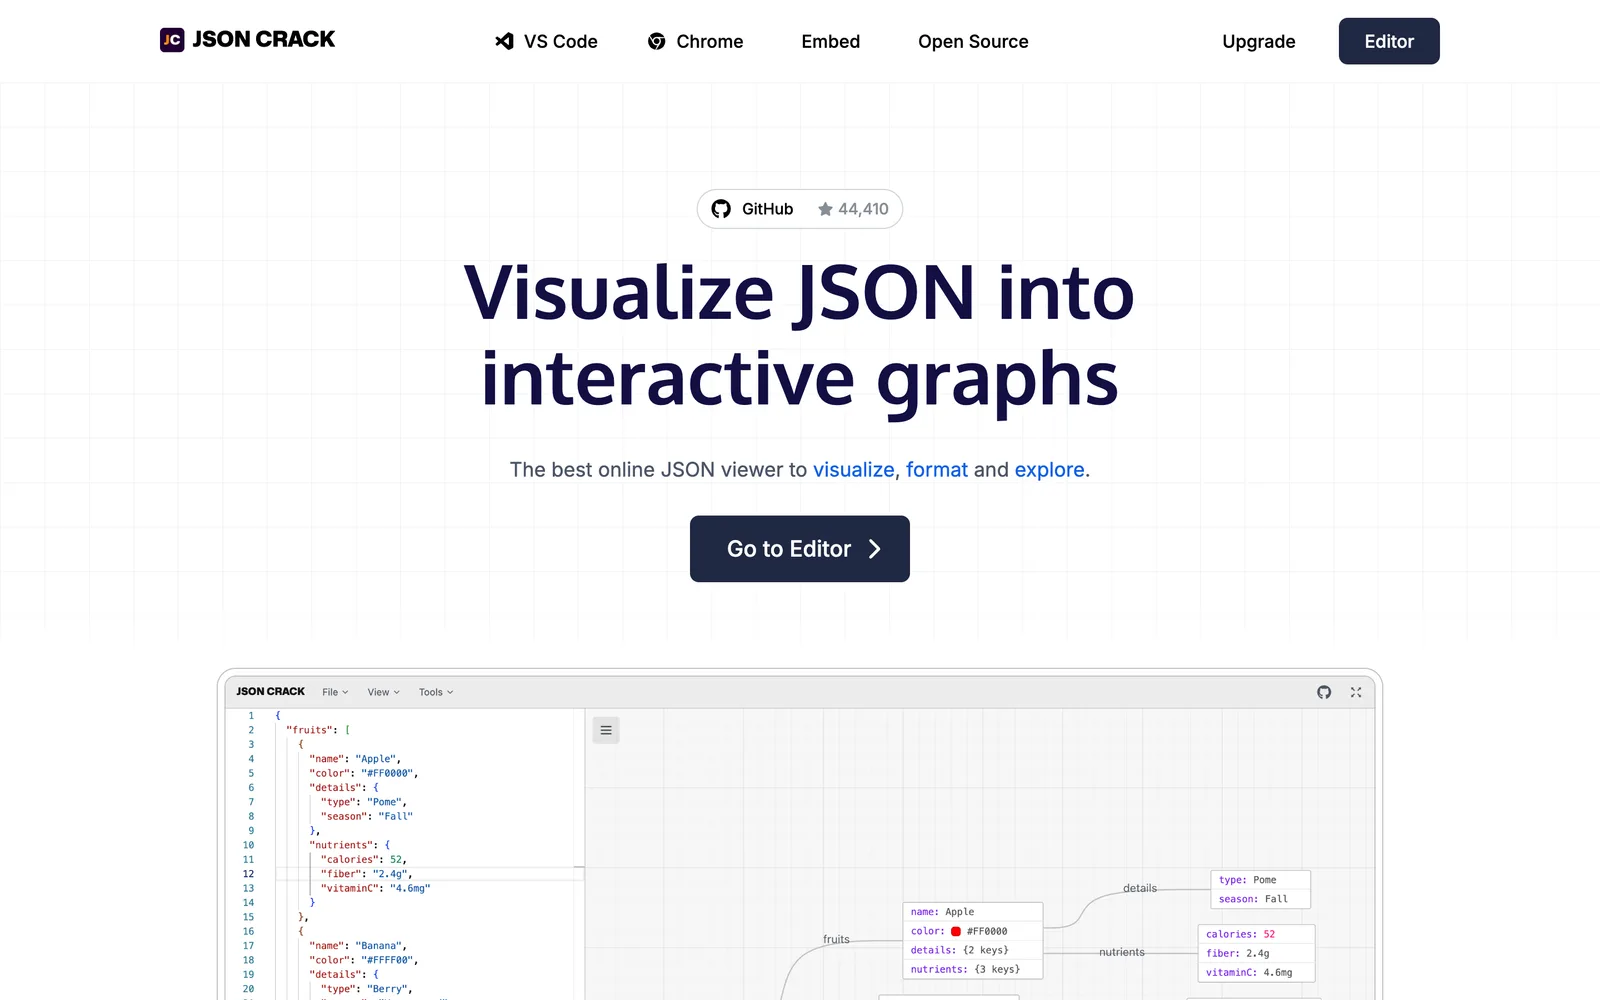
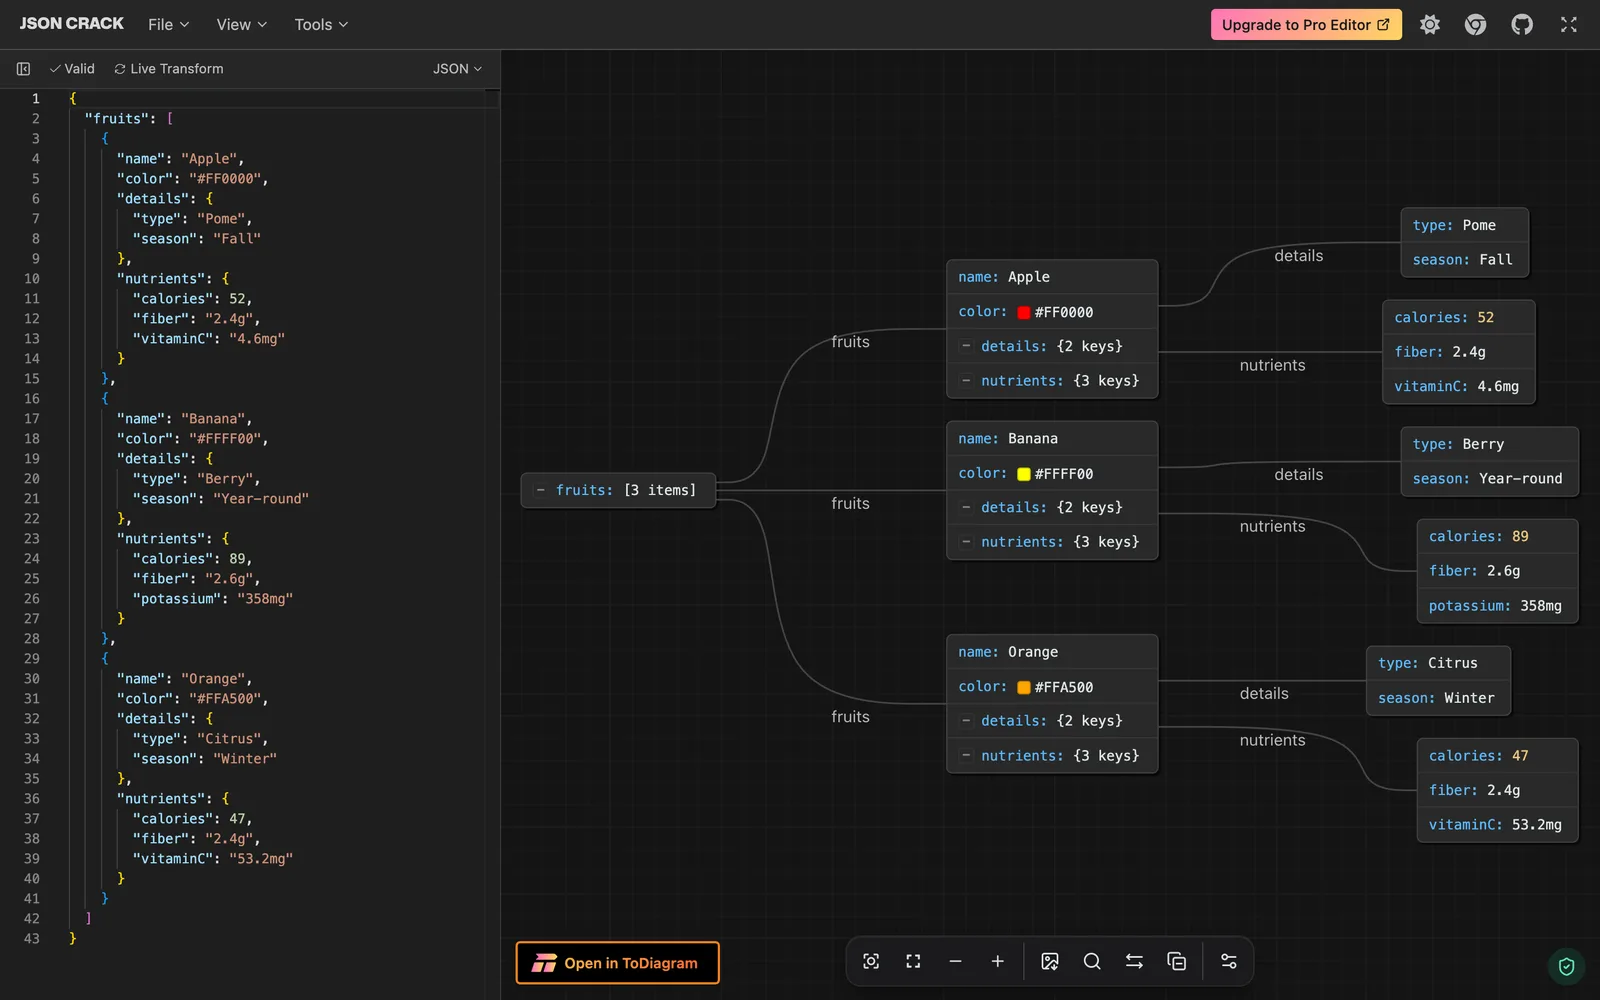
A tool that turns pasted JSON into a navigable graph — a genuinely new way to read nested data, with one critical accessibility finding.
Reading deeply nested JSON in a text editor means holding the structure in your head. Rendering it as a graph you can pan and collapse moves that work out of memory and onto the screen, which is a real interaction idea rather than a restyling.
1.0 MB with first content at 2.6 seconds and the largest paint at 3.9. Reasonable for a canvas tool that has to parse before it can draw.
One critical automated finding, nine serious and forty-one smaller ones. The visualisation is the product and it is entirely visual — which makes the accessibility profile a structural question rather than a list of fixes.
- Client
- In-house product
- Audience
- Developers reading unfamiliar nested data
- Industry
- Developer Tools
- Platforms
- Web
- Status
- Live
- Markets
- Worldwide
- Languages
- 1 — English
02/Honors
Recognized by the editors.
Recognition
Featured
Meets the UXE standard. Earns a public profile, a badge and a place in the quarterly awards.
Conferred by the editors on 25 Sept 2026 · minimum UXE 7.0
Awards
None. The quarterly awards are decided among projects their makers entered, and nobody entered this one — the editors chose it, assessed it and conferred the recognition above. If JSON Crack’s team would like it entered and considered for a season, entering is free.
03/Editors’ verdict
In the editors’ words.
“A real interaction idea: the structure stops being something you hold in your head. It is also entirely visual, and the accessibility findings are a structural problem rather than a to-do list.”
The UXE editors
Selected and assessed by the editors
04/Score breakdown
How the editors scored it.
- Overall UXE Score−0.3 vs Q3 2026 average
- 7.59
- Strongest criterionInteraction & Feedback
- 8.8
- Assessed bytheir own scores, signed
- The editors
- Measured25 Sept 2026
- On the live product
- 8.3+0.2
Usability
Can people complete what they came to do — efficiently, confidently and without error?
- 7.7−0.2
Information Architecture
Is content organized, labeled and navigable in the way people actually think?
- 8.2−0.1
UI & Consistency
Is the visual language coherent and purposeful across every screen and state?
- 8.8+1.0
Interaction & Feedback
Does every action respond clearly, promptly and meaningfully?
Editors’ notePanning and collapsing a large structure stays responsive, which is the entire value.
- 6.3−1.2
Performance
Does it feel fast — perceived and measured — on real devices and networks?
- 5.5−2.3
Accessibility
Can everyone use it, including people relying on assistive technology?
Editors’ noteOne critical and nine serious findings on a product that is purely visual by design.
- 8.3+0.2
Learnability
How quickly does a first-time user become a confident one?
Scores are the editors’ own — this product was selected rather than entered, and the verdict is signed. Ticks mark the Q3 2026 average across 161 recognized projects.
05/Screens
2 screensThe product, screen by screen.
06/Accessibility & performance
Built for everyone, on any device.
Accessibility
Assessed here
Audited by the UXE editors (axe-core 4.10 over the loaded page, plus manual checks), September 2026
5.5
Measured
- No horizontal scrolling introduced at 200% zoom
- Pinch zoom is not blocked
- prefers-reduced-motion is honoured in the stylesheet
- 2 landmark regions, and a page language declared as en
Known gaps
- Automated pass, critical: form elements must have labels (1)
- Automated pass, serious: elements must meet minimum color contrast ratio thresholds (1); <li> elements must be contained in a <ul> or <ol> (8)
- Automated pass, moderate: all page content should be contained by landmarks (41)
- No skip link was found
Performance
2 of 4 within budget
Chrome headless at 1440×900, throttled to Slow 4G (1.6 Mbps down, 150 ms round trip) with 4× CPU slowdown, one cold load, 25 September 2026.
6.3
Measured
| Metric | Measured | Budget |
|---|---|---|
| Largest Contentful Paint | 3.89 s (over budget) | ≤ 2.5 s |
| First Contentful Paint | 2.62 s (over budget) | ≤ 1.8 s |
| Cumulative Layout Shift | 0.000 (within budget) | ≤ 0.10 |
| Page weight | 1018 KB (within budget) | ≤ 1 MB |
Within budget Over budget
07/Credits
The people who made it.
Studio
JSON Crack
The maker of a tool that renders JSON as an interactive graph.
- Recognized
- 1
Team
Individual credits are published when the team submits them. This profile was compiled by the editors, so it names the company and nobody else.
Check it yourself
- Client
- In-house product
- Industry
- —
Built with
→/More from the showcase
Whole seasonMore from the showcase.
8.87
UXE
8.83
UXE
8.76
UXE